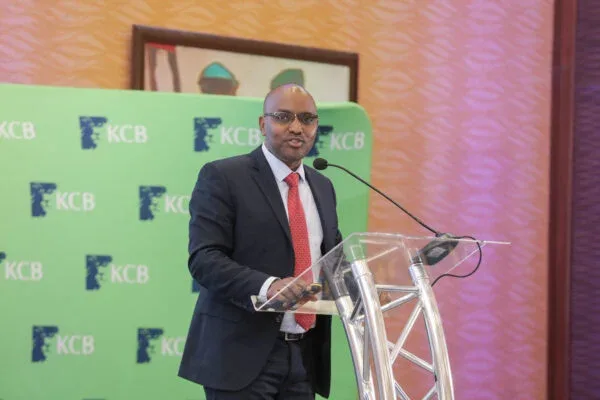
KCB Group has posted Ksh.47.3 billion in net profit for the nine months ended September 2025. This is a 3% rise in profitability as compared to Ksh. 45.7 Billion realized in a similar period last year.
The rise in profitability was on the back of a 4.5% rise in total revenue to KShs.149.4 billion. This was due to a 12.4% rise in net interest income to KShs.104.3 billion. Non-interest income closed the period at KShs.45.1 billion representing a 10.1% decline.
On the other hand, operating expenses grew marginally at 2% to Ksh. 87.3 Billion due to a rise in efficiency. This helped bring down the cost-to-income ratio to 46.2% from 47.4% last year.
During the period, the balance sheet expanded by 2.6% to KShs. 2.04 trillion, this was despite the sale of National
Bank of Kenya (NBK) in May 2025. On a like for like basis, the balance sheet grew by 10.9% demonstrating the Group’s strong bandwidth to support customers across the seven countries where KCB operates.
The stock of gross loans and advances during the period rose 7% to KShs.1.24 trillion, with deliberate focus on key
economic drivers such as building and construction, agriculture, manufacturing, energy and water.
KCB Group subsidiaries excluding KCB Bank Kenya maintained strong performance, with their profit before tax making up 35.0% of the overall Group earnings and 31.3% of the Group balance sheet.
The three non-banking subsidiaries delivered strong PBT performance.
| Subsidiary | PBT (Ksh) | Year-on-Year (YoY) Change |
| KCB Investment Bank | 230M | +90% |
| KCB Asset Management | 118M | +71% |
| KCB Bancassurance Intermediary | 833M | +16% |
The Group’s core capital as a proportion of total risk-weighted assets stood at 17.0% against the statutory minimum of 10.5% while the total capital to total risk-weighted assets ratio was at 19.6% against a regulatory minimum of 14.5%. The Group’s liquidity ratio was 46.7%.
On shareholder returns, Return on Equity (ROAE) stood at 21.6% while Return on Assets (ROA) was at 3.1%. Total equity attributable to KCB Group PLC shareholders stood at KShs.308.5 billion.
| Metric | Q3 2025 Value (Ksh.) | Year-on-Year (YoY) Change |
| Assets | 2.04T | +2.6% |
| Deposits | 1.5T | -1% |
| Loans | 1.1T | +8% |
| Net Interest Income | 104.3B | +12% |
| Non-interest Income | 45.1B | -10% |
| Loan Loss Provisions | 18.3B | +3% |
| Profit After Tax | 47.3B | +3% |
| EPS | 19.12 | +0.6% |
| NPLs (Gross) | 222B | +3% |

