Equity Group has reported a 17% rise in net profit to KSh 34.63 billion for the Half Year 2025. This is as compared to Ksh. which was realized in a similar period last year.
The rise in profitability was on the back of a 9.1% rise in net interest income to KSh 59.30 billion, supported by loan book growth and improved net interest margins across most subsidiaries. While non-interest income grew 4.6% to KSh 42.78 billion, buoyed by higher fees, commissions, and foreign exchange trading income. With operating income rising by 3.1% to KSh 100.20 billion.
On the other hand, Total costs reduced by 2% to Ksh. 58.7 Billion, this was largely driven a 34% decline in the loan loss provision to Ksh. 6.9 Billion.
Total assets reached KSh 1.799 trillion, up 3.0% from H1 2024, driven by investment securities and loan book expansion. Customer deposits rose 1.6% to KSh 1.320 trillion. Total equity increased 25.2% to KSh 276.07 billion, strengthening capital buffers. The Core Capital to Total Risk-Weighted Assets ratio stood at 16.5%, above the 10.5% statutory minimum.
Equity Group’s NPL ratio closed the quarter at 13.7%, down from 14.0% in Q1 2025 but higher than the 12.9% recorded in H1 2024. Corporate segment NPLs rose sharply to 24.5% from 16.1% in June 2024, while MSME improved to 14.2% from 13.5%.
In Kenya, profit after tax increased by 40% from Kshs.13.9 billion to 19.5 billion, net interest income increased by 18% from Kshs. 27.7 billion to Kshs. 32.8 billion after 29% decline on interest expense to Kshs.18.3 billion down from Kshs. 25.6 billion. Total equity grew by 22% to Kshs.154.6 billion from Kshs. 127.2 billion.
In DRC, profit after tax increased by 22% to Kshs. 9.1 billion from kshs.7.4 billion. Loans and advances grew by 13% to Kshs.275.4 billion from Kshs. 244.2 billion funded by a corresponding decline in cash from Kshs. 271.4 billion down to Kshs.236.5 billion. Total equity grew 28% to Kshs.82.6 billion up from Kshs.64.8 billion
In Uganda, profit after tax increased by 40% to Kshs.1.9 billion from Kshs.1.4 billion. Deposits grew by 5% to Kshs.96.8 billion from Kshs. 91.9 billion fueling growth of cash and bank balances by 11% to Kshs.25.7 billion from Kshs.23.1 billion and growth of investment securities by 14% to Kshs.36.8 billion from Kshs. 32.3 billion. Capital grew by 9% to Kshs.16.8 billion up from Kshs. 15.4 billion.
In Rwanda, total assets registered 21% growth to Kshs.130.1 billion up from Kshs.107.6 billion. This was driven by 22% growth in deposits from Ksh.77.7 billion to Kshs.94.7 billion and 23% in loan book from Kshs. 45.5 billion to Kshs. 56.1 billion. A 48% growth in cash and bank balances of Kshs. 42.1 billion up from Kshs. 28.5 billion. Capital grew by 26% to Kshs.19.9 billion up from Kshs.15.8 billion.
In Tanzania, profit after tax grew by 75% to Kshs.1.1 billion up from Kshs.0.6 billion. Shareholders’ funds grew by 67% to Kshs.10.7 billion up from Kshs. 6.4 billion. Loans and advances grew by 19% to Kshs.31.3 billion from Kshs.26.2 billion.
In the bancassurance arm, the balance sheet grew by 40% to Kshs.31.48 billion up from Kshs. 22.4billion. Profit after tax was 27% up from Kshs.520 million to Kshs. 660 million.
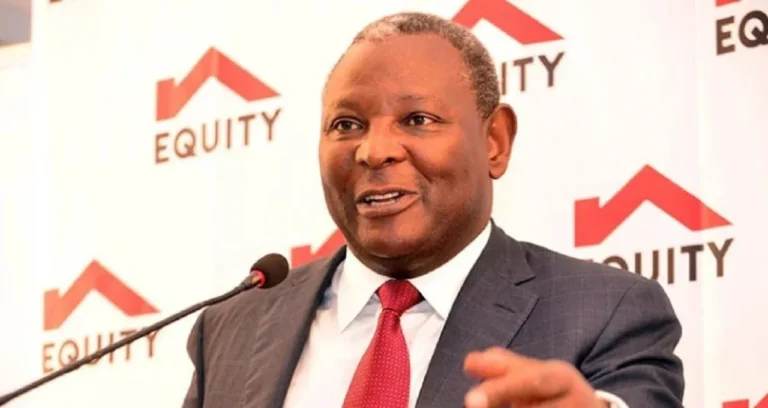
Equity Group Managing Director and CEO, Dr. James Mwangi said, “The execution of the strategic business plan has started to reflect on the balance sheet and performance of the Group in agriculture, mining, manufacturing, trade and investment, and small and medium enterprises (SMEs) that populate the eco-systems of the formal sector in these value chains and is likely to significantly and increasingly transform the structure and performance of the Group. Continued execution has resulted in transformation of the balance sheet structure and the resultant profit and loss structure creating resilience in performance.”

